Abstract
We study how political beliefs shaped risk perceptions and behavior early in the COVID-19 pandemic. We combine county-level mobility data (Unacast), each county's 2016 Trump vote share, and Google Health Trends search activity as a proxy for perceived health risk.
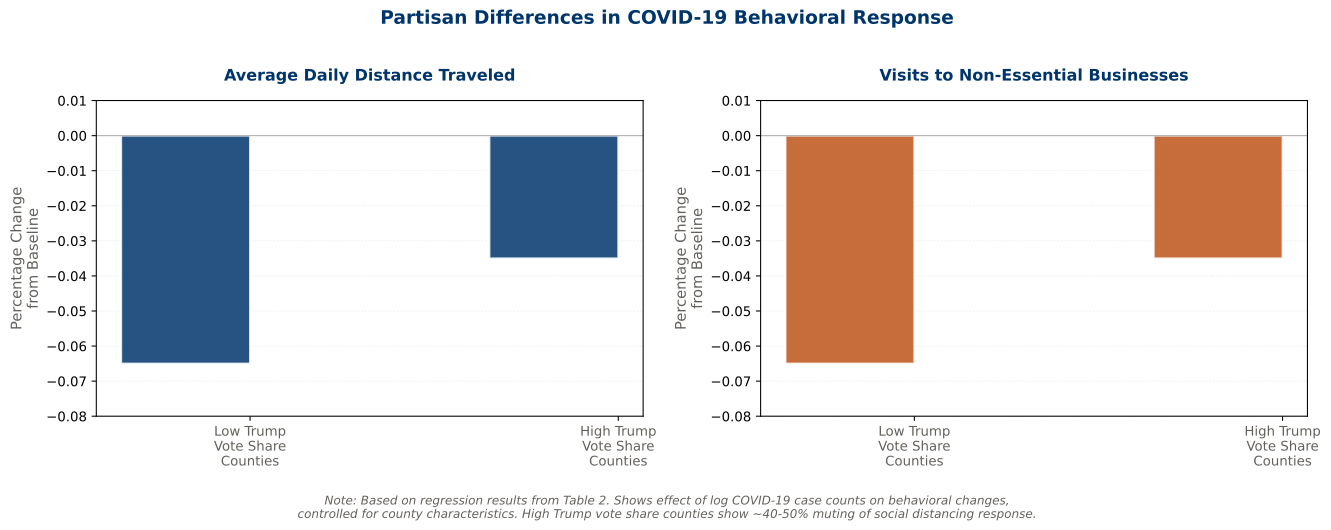
Counties with higher Trump vote share perceived lower personal health risk and cut their mobility less, even after we control for local case counts, demographics, and economic conditions. A one-standard-deviation increase in Trump vote share mutes the social-distancing response by 7.8%, and the top quartile of Trump counties shows about a 40% smaller response. The gap widens with polarized media coverage.
Key Findings
Politics Colors Risk
Counties with higher Trump vote share perceived lower personal health risk and reduced mobility less, regardless of local infection rates.
Sizable Partisan Muting
A one-standard-deviation increase in Trump vote share mutes the distancing response by 7.8%; the top quartile shows about 40%. In the response to state closures, low-Trump counties cut distance traveled 9.3% versus 6.7% in high-Trump counties.
A Media Channel
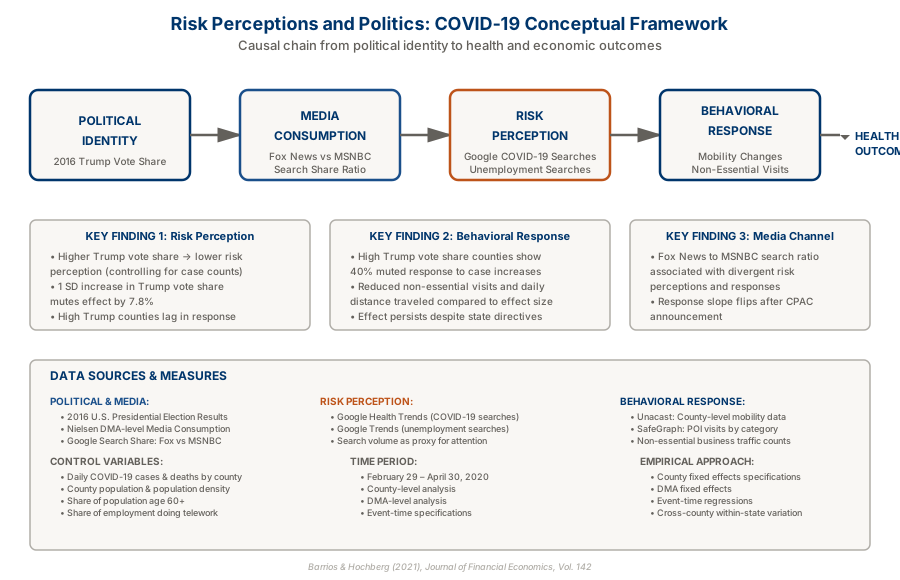
The partisan gap widens with polarized coverage; the relationship between the Fox-versus-MSNBC search ratio and behavior flips after CPAC.
Data and Design
County-level Unacast mobility, 2016 vote shares, Nielsen media markets, and Google Health Trends, with controls for cases and deaths, age, telework share, and population density.
Figures
Data & Design
We combine county-level mobility from Unacast, each county's 2016 Trump vote share, and Google Health Trends search activity as a proxy for perceived health risk. Regressions control for local case and death counts, demographics, telework share, and population density, and we use Nielsen media markets to test whether local media coverage widens the partisan gap in behavior.