Abstract
We examine the effect of the introduction of ridehailing (Uber and Lyft) in U.S. cities on fatal traffic accidents. A naive view holds that ridehailing should improve road safety by substituting professional drivers for impaired or unwilling ones, holding vehicle miles traveled fixed. In practice, ridehailing drivers spend much of their time on the road between fares, many riders substitute away from transit, walking, or biking rather than from their own cars, and reliance on in-app navigation invites distraction—so the net effect on safety is an empirical question.
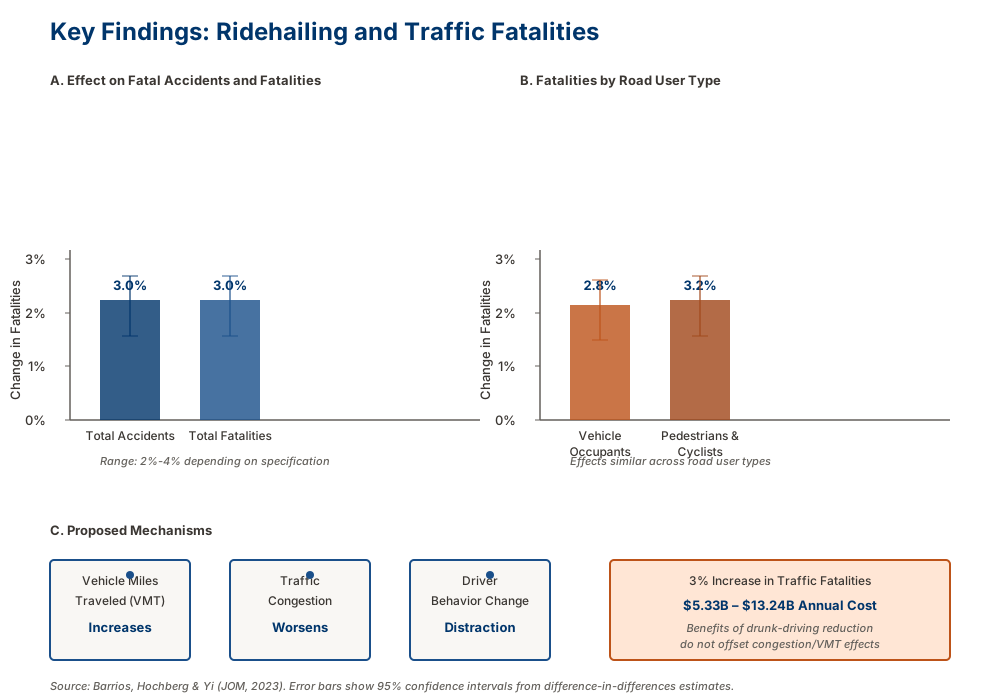
Using the staggered rollout of ridehailing across cities in a generalized difference-in-differences design, we find that ridehailing entry is associated with an approximately 3% increase in fatal accidents and fatalities—about 3.6% in our main specification, and 2%–4% across specifications. The increase rises with the intensity of local ridehailing adoption and persists throughout the week, on weekends, and at night. Consistent with a road-usage channel, entry coincides with higher proxies for traffic congestion and an increase in new car registrations; consistent with a driver-quality channel, the increase is concentrated in ridehailing-eligible vehicles, with no offsetting decline in drunk-driving fatalities. Back-of-the-envelope estimates put the annual cost of these additional fatalities at $5.33 billion to $13.24 billion.
Key Findings
More Fatal Accidents
Ridehailing entry raises fatal accidents and fatalities by roughly 3% (about 3.6% in the main specification; 2%–4% across specifications), and the increase grows with the intensity of local ridehailing adoption.
Persists Across the Week
The increase holds throughout the week—weekdays, weekends, and nights—and is somewhat larger on weekends and at night. Weekend nights, when ridehailing is most likely to displace impaired drivers, show the smallest increases (2.50% and 2.69%).
Road Usage and Driver Quality
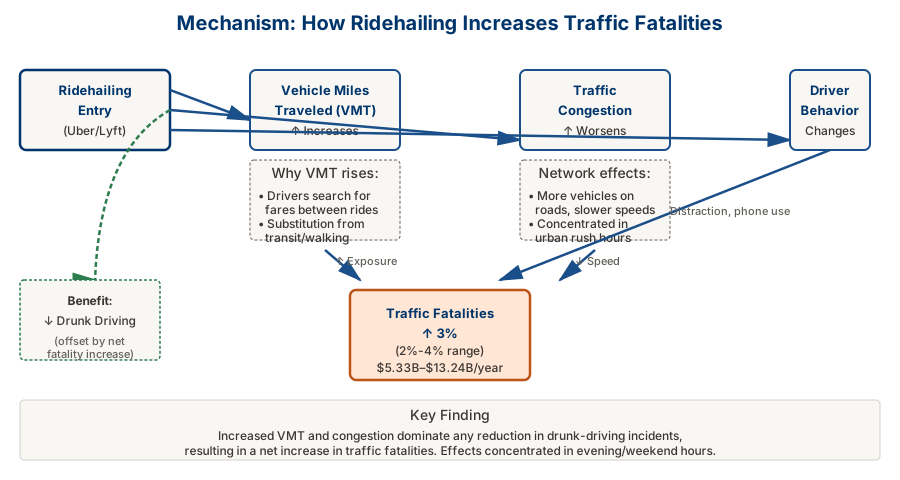
VMT, excess fuel use, and hours of traffic delay all rise after entry, and new car registrations increase about 3%. With no decline in drunk-driving fatalities, added road exposure and lower average driver quality outweigh any safety benefit.
A Public-Safety Externality
Individual convenience gains from ridehailing impose collective safety costs. Back-of-the-envelope estimates place the annual cost of the additional fatalities at $5.33 billion to $13.24 billion—a cost measured in human lives.
Figures
Mechanisms and Evidence
The increase in fatalities operates through two channels the paper isolates. On the quantity side, ridehailing raises road usage: vehicle miles traveled, excess gasoline consumption, and annual hours of traffic delay all rise following entry, and new car registrations increase about 3% as vehicles become productive assets for gig drivers. Because ridehailing drivers cruise between fares and many riders substitute away from transit, walking, or biking, the total miles driven exceed the personal trips displaced.
On the quality side, the increase is concentrated in vehicles eligible to serve as ridehailing vehicles and in passenger configurations suggestive of ridehailing, consistent with distraction from in-app navigation and a decline in the average quality of drivers on the road. Crucially, we find no reduction in drunk-driving-related fatal accidents after entry, so the substitution of ridehailing for impaired driving does not appear to deliver an offsetting safety gain. The effect also extends to bystanders: pedestrian- and cyclist-involved accidents and fatalities rise by 2.45% to 2.77%, somewhat below the overall effect but confirming an externality borne by non-vehicle occupants. The estimated increase persists—and, if anything, grows about six quarters after entry—consistent with a lag between a service's launch and its widespread local adoption.
Policy Implications
Ridehailing delivers real convenience and cost savings to riders and flexible earnings to drivers, but our estimates show that these private benefits come with a social cost in the form of additional traffic fatalities. When negative externalities of this kind are not internalized, the private calculus of individual users can diverge from the social one, so models of optimal platform operations and regulation should account for the safety costs that added road usage and reduced driver quality impose.
We close by discussing operational and policy prescriptions—from platform design changes that reduce between-fare cruising to local regulation aimed at congestion and safety—that could help limit these externalities. Because the underlying mechanisms are common to app-based driver-matching platforms, the lessons likely extend beyond ridehailing to food-delivery and similar on-demand services.